
AI visibility audits and reporting
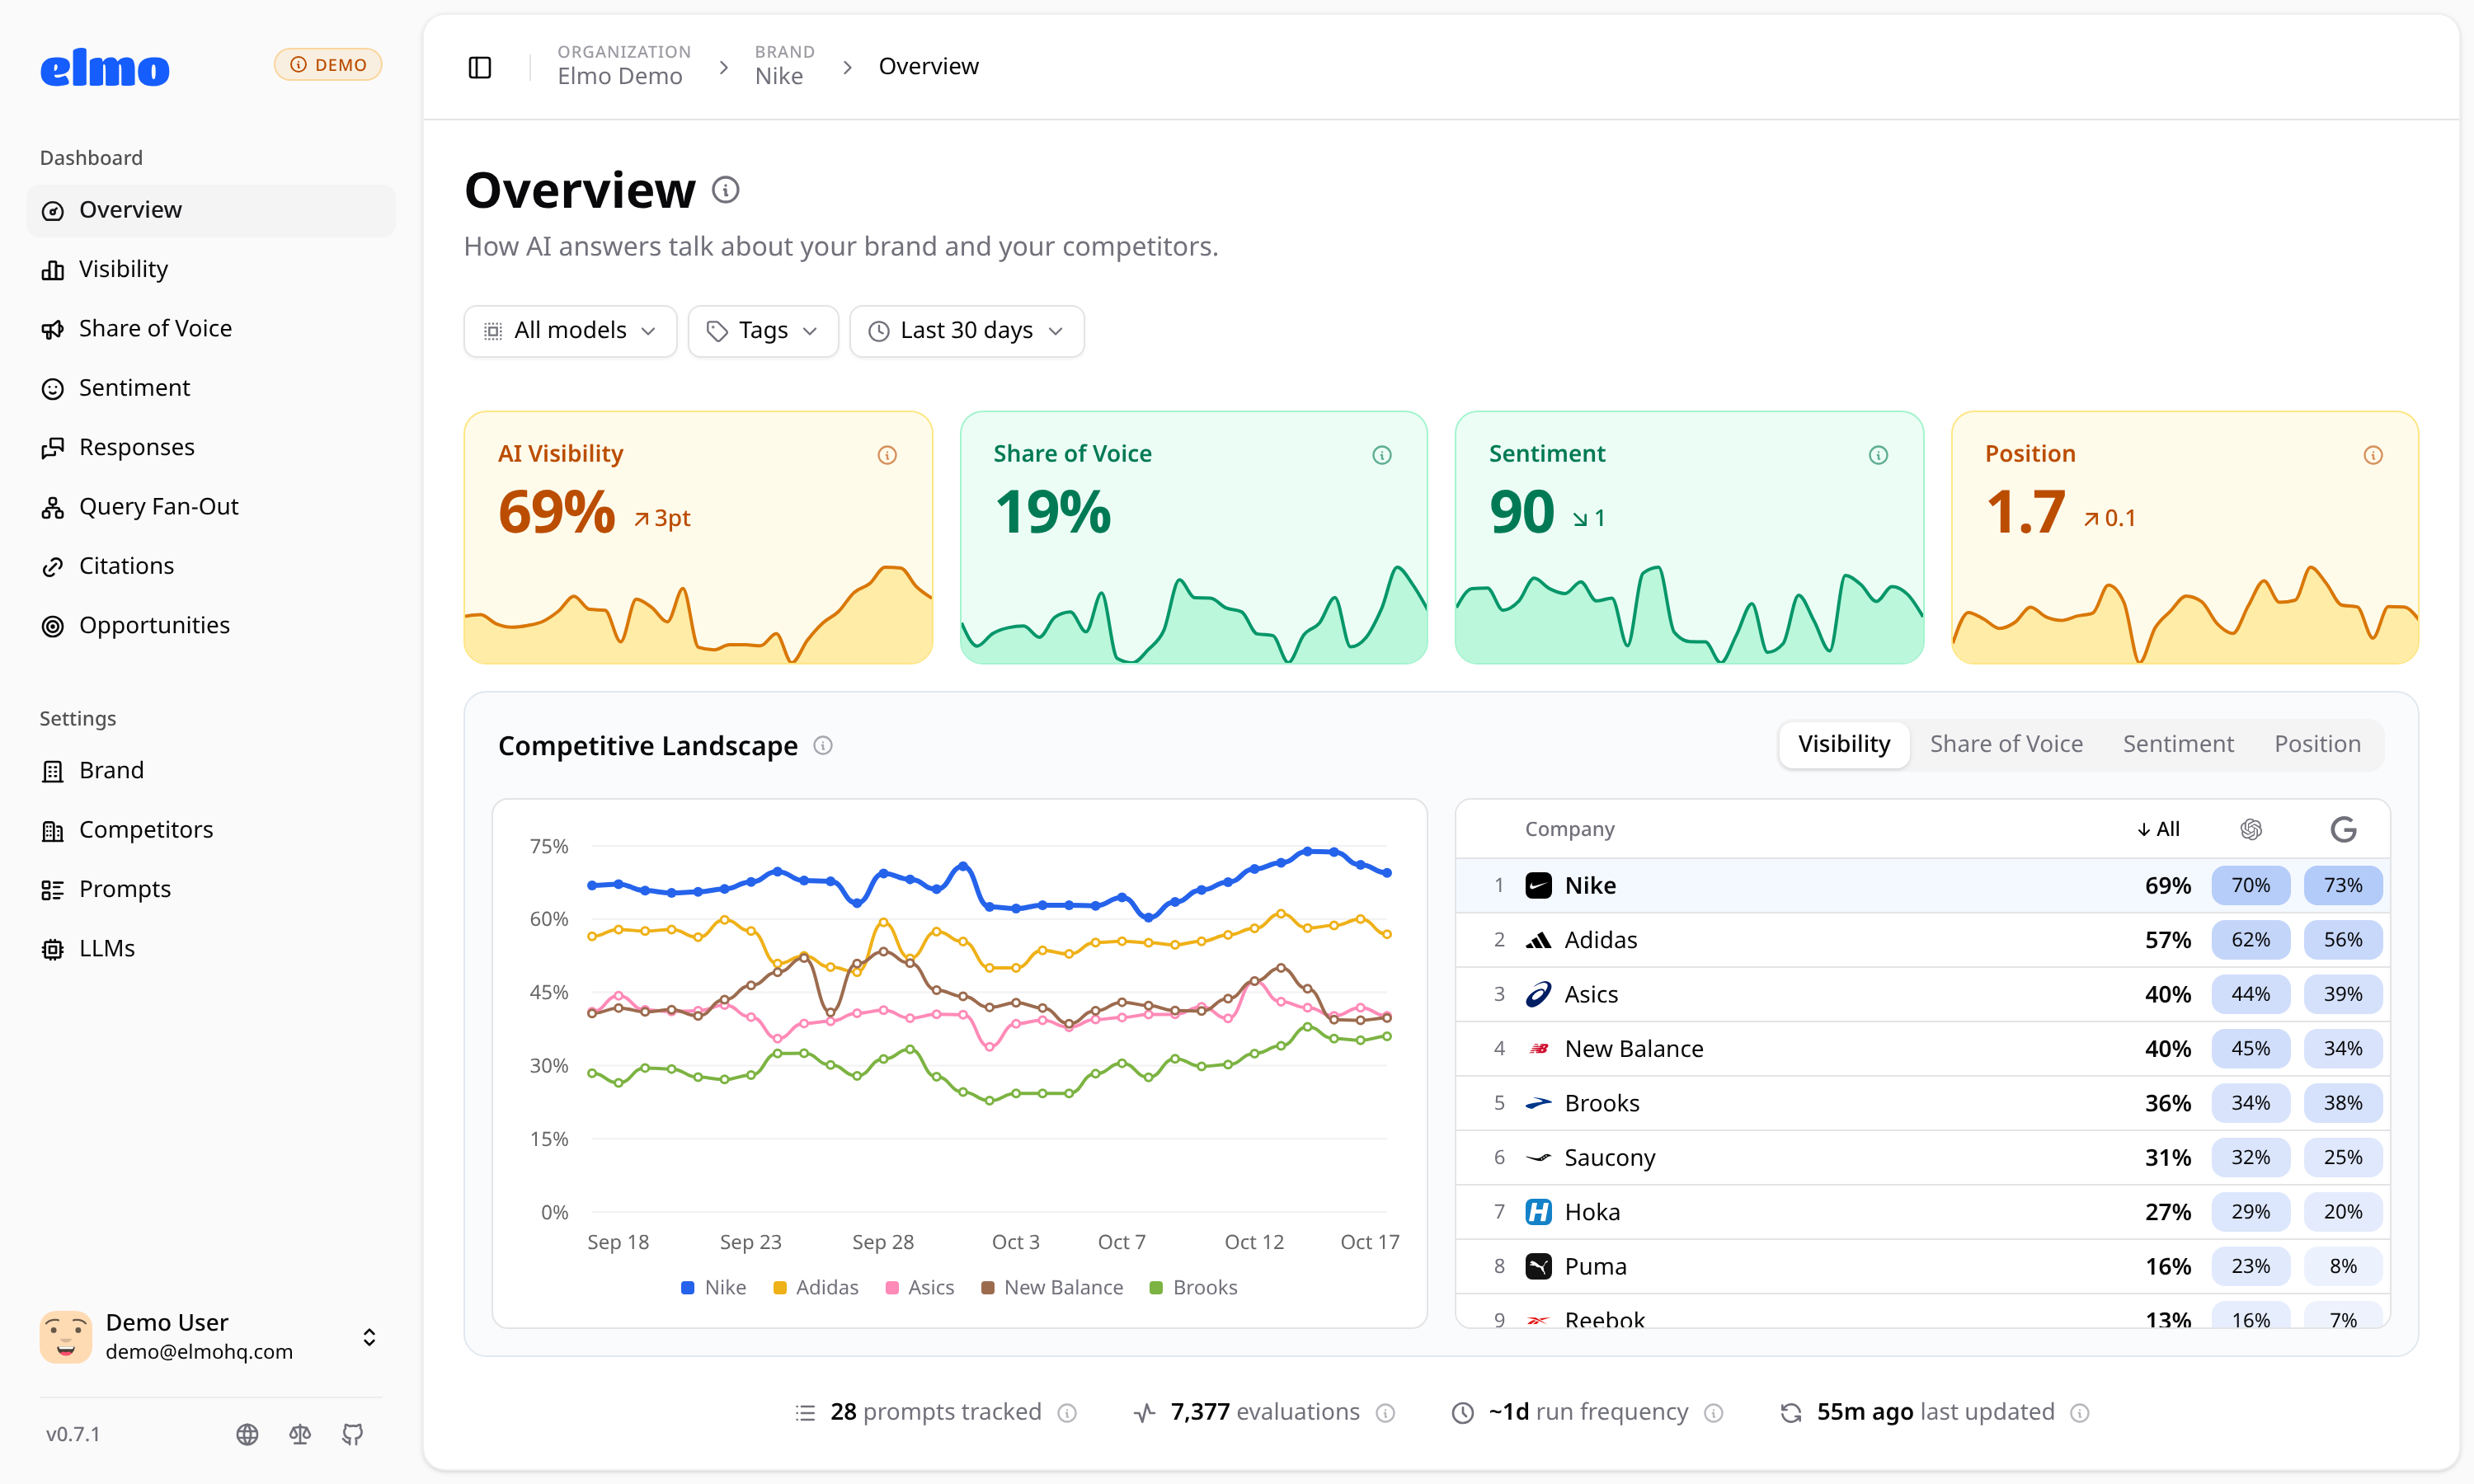
Signal's overview puts visibility, share of voice, sentiment, and position on one screen, with every competitor ranked beside you. Run a full audit on demand and compare it with any earlier one, export charts for a deck, or pull the numbers into your own dashboards through the API.
What You Can Do
1Start from the overview
Four headline cards, how they changed, and a comparison of you and your competitors on every AI engine.
2Run an audit and compare
Click Run Now to ask every prompt on every platform at once, then compare any two audits to see which prompts, platforms, and competitors moved.
3Send it where you report
Download prompt charts as PNGs for slides, or pull analytics into a spreadsheet or BI tool through the REST API.
Data You Can Act On
- Headline cards
- Visibility, share of voice, sentiment, and position, with their change.
- Competitors by model
- Every tracked company on every AI engine, sortable by any model or by the overall figure.
- Audit comparison
- Visibility, mentions, and share of voice between two audits, by prompt, platform, and competitor, with new and closed gaps.
- Audit history
- Every daily and Run Now audit, kept for 90 days, 365 days, or without limit depending on the plan.
- Prompts tracked and evaluations
- How much tracking is behind the numbers.
Use Cases
- Answer 'why is organic traffic down?' with numbers on how AI answers mention you instead.
- Run an audit before and after a content push, then show exactly what changed.
- Combine AI visibility with your other marketing data in your own BI tool.
Why Signal
Numbers you can defend
Every figure traces back to stored answers, and how each one is calculated is documented.
Before and after, side by side
Audits are saved as they happen, so a comparison shows real answers from both dates, not a reconstruction.
Your data, your tools
Everything on the dashboard is available through the REST API and the MCP server.
Related Guides
Related Features
All Features- AI visibility trackingHow often AI answers mention your brand, per prompt and per model, with trends over time against every competitor.
- API and MCPA REST API with a published OpenAPI spec, and an MCP server for AI assistants.
- OpportunitiesContent to create, pages to refresh, and sources to pitch, generated from your own visibility and citation data.
Frequently Asked Questions
Something we didn't cover? Email us at signal@metricshive.com.
What is a Run Now audit?
A Run Now audit asks every enabled prompt on every platform you track at once and saves the results. Starter includes 1 per brand each month, Growth 4, and Pro 10. Your daily runs are also saved as an audit each day.
What does comparing two audits show?
The change in visibility, brand mentions, share of voice, and positive and negative mentions, plus each prompt's and platform's visibility before and after, each competitor's mentions, and the gaps where a competitor is named and you aren't.
Can I export Signal data into my own dashboards?
Yes. The REST API returns visibility, share of voice, citations, per-model, prompt, and query fan-out metrics for any time window.
Can I export charts?
Yes. Prompt charts download as PNGs sized for slides and reports.
Start winning AI search today.
Start tracking your brand in minutes. Plans start at $49/mo.
- Self-serve
- Unlimited seats
- API and MCP access
Need a custom plan? Talk to Sales.